We have analysed the building performance and drawn the following conclusions:
Whilst, during the observed period, external temperatures varied by 39 degrees, internal temperatures varied by only 18 degrees and a comfortable internal temperature was maintained.The natural cooling system combined with the thermal flywheel provided a comfortable cool environment in summer with a thermal time-lag of about four hours, as seen in the flattened internal graph line compared with the more varied external graph line.
The house heating system is only required for six hours a day (in the afternoon to evening). The house benefits from the effects of solar gain and this can be seen in the cold winter’s day graph lines.
Overall, a combination of passive cooing and heating systems, with few moving parts means the occupants benefit from low capital cost, low running cost systems.
The conclusions have been drawn from the following analysis:
Cooling and heating:
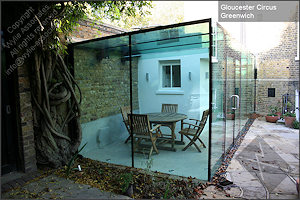
The house at Bothy Vineyard is laid out to take advantage of natural heating and cooling with systems designed to be economic to build, run and maintain. Especially designed for the house, the VAX (Ventury Air eXtraction) system provides natural summertime cooling and, having no fans and few moving parts, offers a very low lifetime cost solution. This is developed from our conservation experience of similar Victorian ideas at the Natural History Museum. The house also has solar panels for hot water and for electricity generation.
Thermal flywheel:
The natural heating and cooling systems rely on the principle of the thermal flywheel and the curved wall of the conservatory provides the mass required to make it work.
Use of the heating and cooling systems:
The client switches on the natural cooling system during hot periods in the summer. In Autumn and Spring, the client uses the wood-burning stove to provide hot water, also providing supplemental heating. In winter the client switches on the heating at 4:00pm and switches it off at 10:00pm.
Measurement of performance:
We have installed a weather station to measure changes in the house’s internal environment as the external environment changes. We have collected data from the beginning of July 2006 including internal temperature, external temperature, wind speed, wind direction and rainfall. Internal and external temperatures have been plotted on graphs (see below) and the following observations made:
External/ internal temperatures – July 2006 to February 2007 inc.:
![]()
![]()
External temperatures reached the following maximum and minimum (with the corresponding internal temperatures):
| External | Internal | Difference | |
| 2:00pm on 12th July 2006 | 34.7 | 26.1 | 8.6 |
| 5:30am on 22nd December 2006 | -4.4 | 18 | 22.4 |

![]()
![]()
External temperatures reached the following maximum and minimum (with the corresponding internal temperatures):
| External | Internal | Difference | |
| 2:00pm on 12th July 2006 | 34.7 | 26.1 | 8.6 |
| 4:00am on 23rd July | 6.0 | 20.8 | 14.8 |

![]()
![]()
The internal temperatures peaked about four hours after the peak external temperatures. The internal temperature varied from 20 degrees to 28 degrees whilst external temperatures varied from 8 degrees to 35 degrees.

![]()
![]()

![]()
![]()

![]()
![]()
Simplicity is key to the movement of cooling and heating around the house and this achieved though openable windows both externally and internally. Air moves naturally from one space to another as and when required; warm air in winter and cool air in summer. The environmental systems of natural heating and cooling are built into the design of the house from the outset; a low-cost/ high benefit approach.